Thursday, June 30, 2016

New BDCs Added to Q3 2016 Coverage

There are over 50 publicly traded BDCs and historically I have focused on the larger companies with higher trading volumes. However, many of the lesser known BDCs have been outperforming including dividend coverage and growth as well as NAV stability, driving better stock performance. Over the coming weeks, I will be adding many new BDCs to ‘active coverage’ which includes pricing, overall and risk rankings, full projection reports and charts, dividend coverage tiers, interest rate sensitivity, leverage analysis and suggested portfolios. I am still expecting upcoming BDC volatility to drive prices lower, providing better entry points for higher quality BDCs. Also, there are some potential equity offerings. I will likely be purchasing the ones with higher first-lien portfolios, NAV per share stability potential, shareholder friendly fee agreements (see below) and superior dividend coverage. However, these BDCs are usually lower yield and I will also be including some of the higher yield BDCs.

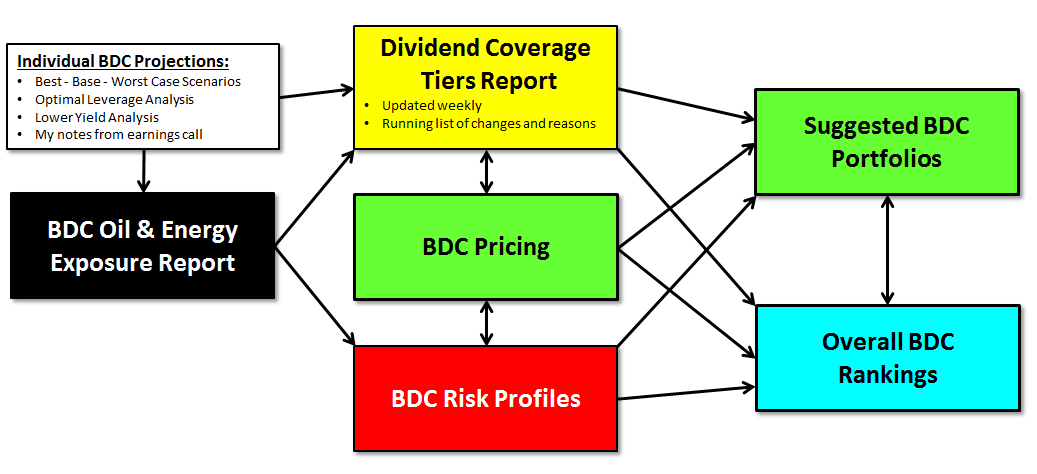
My goal is to prioritize the best potential performers as well as underpriced/overlooked BDCs that are offering higher yields. I will be adding some of these BDCs to the updated Suggested BDC Portfolios report as well as removing BDCs that have been downgraded to ‘Tier 3’ dividend coverage and likely to cut dividends later this year. I will have public articles for some of these companies to increase exposure/awareness and hopefully trading volumes and pricing, but they will mostly discuss basic information such as historical dividend coverage, change in NAV per share and high-level asset mix.  See below for examples.


Currently, I am researching the following items for each company before adding to coverage:
  • Risk (portfolio credit quality and vintage, quality of management, historical credit and NAV performance, effective leverage ratios, portfolio diversification, rate sensitivity, and the need to reach for yield to sustain dividends)
  • Profit (historical and projected dividend coverage, yield compression sustainability, repayment exposure, recurring vs. onetime income, PIK vs. cash, EPS growth/decline, operational cost efficiency)
  • Return (regular/special dividends, risk adjusted, dividend sustainability/growth, NAV stability/growth)
  • Valuation (total return, appropriate yields, NAV and earnings multiples, growth rates)


High Water Mark Fee Structures:

As discussed in many of my articles, The older incentive fee structures can incentivize management to take on increased risk with investors' capital. Management benefits from higher yields with less downside related to future credit issues or the lack of capital losses included when calculating income incentive fees.  This could lead to management taking higher risks (for increased yields) with investors’ capital due to being insulated from potential losses when calculating the income portion of the incentive fees. Ultimately, management could receive higher fees during periods of declining NAV per share, resulting in lower total returns to shareholders.


Thursday, April 14, 2016

Earnings Season for BDCs: Which BDCs Will Outperform in Q1 2016?

Included in this update:
  • Quick BDC Market Update
  • Q4 2015 NAV Changes vs. Stock Price Performance
  • BDC Reporting Dates
  • Updates on Q1 2016 Results
  • What can we expect for the BDC sector for the rest of 2016?
  • Current Dividend Yields and Multiples of NAV


Quick Update:

BDCs continue to rally and are up another 6% on average since my last newsletter and easily outperforming the S&P 500 and high-yield bonds (before including dividends) as shown in the chart below. I am still expecting a pullback but happy to see a continued rally as BDCs have been underperforming the general markets since 2014.

I have also indicated when BDCs began to report Q4 2015 results which is also when they began to outperform compared to other high-yield investments and the general market. There are many potential reasons for this as discussed in my previous updates and articles. However, not all BDCs have participated equally in this rally and I am expecting a wide range of operating results in the coming weeks that will likely cause increased bifurcation in multiples and price performance.


Q4 2015 NAV Changes vs. Stock Price Performance:

There has been a wide range of performance for BDCs in 2016. The following chart/table shows the recent stock price performance for HTGC, MAIN, FSC and MCC compared to the average BDC and S&P 500. Clearly investors are paying multiples based on operating results and credit quality as MCC and FSC have continuously had credit related within their portfolios. I am expecting various other BDCs to have similar issues in 2016 and investors need to closely watch the upcoming results for signs of changes in portfolio credit quality beyond NAV per share including the restructuring of investments, individual writedowns, management discussions on calls and footnotes, etc.


BDC Reporting Dates:

BDCs will begin reporting Q1 2016 in two weeks.


Real-Time Updates on Q1 2016 Results:

When investing in BDCs, timing is everything and for investors that would like to receive active updates as BDCs begin to report, please visit ‘BDC Reports’ that also includes all reports from the previous quarter including:

  • Individual BDC Projections & Dividend Sustainability
  • Rankings (risk, return, pricing, dividend potential)
  • Pricing Charts & Valuation
  • Interest Rate Sensitivity Comparisons
  • Suggested BDC Portfolios
  • Announcements of Upcoming Purchases & My Current Positions

What can we expect for the BDC sector for the rest of 2016?

  • Potential (or continued) portfolio credit deterioration for poorly managed companies
  • Continued and increased bifurcation driving a wide range of performances
  • Investors realizing that passive income from investments will be more difficult than historically
  • Market overreaction to general market changes including interest rates and credit cycle/economic concerns
  • Lower competition from banks due to increased regulations

Current Dividend Yields and Multiples of NAV per Share:


Tuesday, June 30, 2015

BDC Buzz Update: June 30, 2015


Included in this update: 

  • S&P 500 Volatility Index (VIX)
  • BDC Market Dips
  • Changes in BDC Yields & NAV Multiples

This is a quick update for newsletter subscribers as market volatility has created another potential buying opportunity for BDC investors. If you are interested in receiving updates on my purchases or dividend sustainability, risk assessment and rankings, target prices, earnings projections and portfolio recommendations please visit premium reports.  Please make sure that you have adjusted your ‘subscriber preferences’ to receive updates on specific BDCs.


S&P 500 Volatility Index (VIX)

As mentioned in previous newsletters, investors should take advantage of general market weakness to purchase BDCs especially higher quality companies that usually trade at a premium with lower than average yields. One of the general market indicators that I watch is the S&P 500 Volatility Index (VIX) that is already close to 20 which is when I prefer to make BDC purchases.


Buy on the Dips

As you can see in the following chart, BDCs have had three major dips over the last 12 months and they coincide with the VIX above 22.


Changes in BDC Yields & NAV Multiples

The good news is that investors are able to get higher yields as shown in the following table.


Please visit ‘Premium Reports’ if you are interested in more information about BDCs including:
  • Pricing and Valuation
  • Suggest BDC Portfolios
  • My Current Positions
  • Individual BDC Projections
  • Dividend Coverage Potential
  • Rankings (risk, return, pricing, dividend potential)

Monday, June 15, 2015

New BDCs Added to Coverage: BDC Buzz Report June 2015

My upcoming articles on Seeking Alpha will reflect most of the information in this newsletter including upgrades/downgrades to certain BDCs as well as favorable/unfavorable reviews of newly covered BDCs. If you would like advance notice of when these articles are coming out please see the information at the end of the newsletter.

Included in this newsletter:
  • Actual Total Returns by BDC
  • Improved BDC Fee Structures & Shareholder Alignment
  • Fee Structures vs. Actual Total Returns
  • New BDCs Adding to Coverage

Actual Total Returns – Last 17 Months

Explanation of total returns: The ‘Change in Stock Price’ assumes you purchased the stock at the beginning of 2014 and sold as of June 12, 2015. Dividends do not assume reinvestment and are calculated using the amounts paid divided by the purchase price at the beginning of 2014.


Improved BDC Fee Structures & Shareholder Alignment

I am currently in the process of assessing new BDCs with fee structures that protect total returns to shareholders. Specifically, I am looking for realized/unrealized losses to be included when calculating incentive fees for management with a look-back feature to keep management on the hook for the performance of investments over the long-term.  I will be referring to this as a ‘high water mark’ in upcoming articles.

FSIC has included this feature and recently discussed on the last earnings call: “Alignment of management interests with those of FSIC shareholders is of critical importance to us. We have sought to achieve this through the adoption the three-year “high water mark” for our income incentive fee and through our strong level of sponsor commitment.”

Why do fee structures matter?

The following chart is similar to the one used in my BDC Total Returns & Continued Bifurcationarticle (updated with returns from previous table) and I have identified which BDCs have higher vs. lower fee structures as well as the ones with a high water mark or look-back feature.  Historically, BDCs with lower fee structures have provided higher returns to investors:


As you can see AINV and GLAD have higher returns, compared to other higher cost BDCs that could be partially due to waived management fees to ensure dividend coverage on an annual basis.

Potential BDCs Added to Coverage

All of the BDCs that I actively cover have been public for at least 3 years, with the exception of TSLX and FSIC that I have recently added. Over the last ~2 years, there have been at least 10 new publicly traded BDCs that have a high water mark or look-back features to their incentive programs, including Goldman Sachs BDC (GSBD) that I believe is currently overpriced with a much lower than average dividend yield. However, I believe that there are many other BDCs that are potentially under-priced and overlooked by investors.


Beyond a shareholder-friendly fee structure, investors need to consider the following:
  • Dividend coverage and growth potential
  • Risk profile/portfolio credit quality
  • Management quality
  • Valuation and pricing
  • Potential NAV growth and total returns
If you are interested in dividend sustainability, risk assessment and rankings, target prices, earnings projections and portfolio recommendations for these newly covered BDCs please visit premium reports.


Subscribers to premium reports will also receive advance notice of upcoming articles on Seeking Alpha indicating whether or not they will likely have positive coverage of these potentially overlooked BDCs, including one that will be coming out later this week.  Please visit "premium reports" if you are interested in more information on BDCs including:
  • Rankings (risk, return, pricing, dividend potential)
  • Individual BDC Projections
  • Pricing and Valuation
  • Dividend Coverage Potential
  • Suggest BDC Portfolios
  • My Current Positions
 

Friday, January 9, 2015

BDC Buzz Report: January 2015

The following was sent out to my newsletter subscribers. If you have signed up but did not receive please check your spam/junk folder settings. 

FYI – I have decided to make this newsletter a monthly publication that will include more detail in the following months.

Included in this report:
  • BDC Market Update
  • Example: FSC Dividend & Fee Income Analysis
  • BDC Earnings Announcements & MCC: Items to Watch

BDC Market Update

As discussed in many recent articles, 2014 was a tough year for BDCs due to them being removed from the S&P and Russell indices, continued interest rate fears, general declines in small caps, selling institutional shareholders over the last two quarters and December tax-loss sellers. More recently, investors have been concerned with oil and energy exposure among portfolio investments. BDCs have started to rebound and are up an average of 5% since mid-December.


FSC Dividend & Fee Income Analysis

The following analysis is for dividend and fee income comparison only – these are not my projections.

After each company reports results I use a similar analysis to assess dividend coverage going forward. Key items to watch are stated and effective portfolio yields, fee and dividend income potential and operation cost efficiencies. Other important items are related to portfolio credit quality.  Many BDCs are reliant on non-interest income to cover dividends that can cause swing in quarterly EPS/NII and dividend coverage.  The following is an example using Fifth Street Finance (FSC) that recently increased its dividend and relies on dividend and fee income to support 20% of its dividend payment.


The following are the analyst estimates for the next two quarters.


Earnings Announcements: Items to Watch

So far only six BDCs that I follow have reported results including AINV, GLAD, GBDC, PFLT, PNNT and PSEC. This week FSC, MCC and FULL will be reporting and investors should pay close attention to dividend coverage potential and portfolio credit quality indicators, especially for MCC.  As discussed in “Medley Capital Update For FQ4 2014”, the company recently reported a large decline in its portfolio yield and was only able to cover dividends due to strong fee income. This could be a problem going forward depending on a few things including increased non-accruals and lower amounts of non-interest related income such as fees and dividends. Please see the FSC example below.


I have already weighed in on the Prospect Capital (PSEC) dividend coverage potential in my “PSEC: Dividend Coverage Stress Test” and if you would like to receive similar analyses for the remaining BDCs please visit “Premium Reports”. For most companies I try to turnaround the new information before markets open the next day with my personal recommendations. Currently there are around 40 reports including dividend coverage, oil and energy exposure, interest rate sensitivity, my current positions and allocations, overall rankings and pricing, suggested portfolios, etc.


  • $65 for all reports through 6/30/15
  • $95 for all reports through 9/30/15
  • $145 for all reports through 12/31/15
  • Link to report details: Sign Up
  
http://bdcbuzz.blogspot.com/2013/12/premium-subscriber-sign-up.html


Wednesday, December 17, 2014

BDC Surveys


I will be using this page to host upcoming links to surveys as well as the results:


Each survey will provide a link after completion showing the results so far, but please bookmark to check back in after all results are recorded.

Current Surveys:


Monday, December 15, 2014

BDC Buzz Report: 14 December 2014


BDC Market Update

This year has been difficult for BDCs due to being removed from the S&P and Russell indices, continued interest rate fears, general declines in small caps, selling institutional shareholders over the last two quarters and December tax-loss sellers.  I believe that some investors have been selling baskets of investments, including higher quality BDCs, which has created an opportunity for investors. At some point, BDCs will rebound and I will have a series of articles coming out that discusses many of the positive signs that we are seeing including lower borrowing costs, stabilizing or even increasing portfolio yields and less competition from banks as they continue to exit level 3 assets.


Over the next two to three weeks, BDCs will either continue to fall, have a ‘dead cat bounce’ or potentially have a sustained rally into 2015. Investors should be ready for all three of these scenarios and to buy preferred BDCs over the coming weeks. As shown in the previous chart, I believe investors are currently reacting out of fear (in both the general and BDC markets).  The following chart shows the VIX hitting a high in mid-October at the same time BDCs hit a low for the year and there are signs that the VIX is headed to these levels yet again. Volatility – or “market whiplash” – is clearly back in the market.


The CNN Money Fear & Greed Index:

Investors are driven by two emotions: fear and greed. Too much fear can sink stocks well below where they should be. When investors get greedy, they can bid up stock prices way too far.

“We look at 7 indicators:  For each indicator, we look at how far they've veered from their average relative to how far they normally veer. We look at each on a scale from 0 - 100. The higher the reading, the greedier investors are being, and 50 is neutral.”


Source: CNN Money

What should investors do over the next few weeks?

Investors should be ready to buy BDCs that fit their investment profile.  Recently I have noticed that pricing multiples have changed to reflect investors’ perceptions of dividend coverage and risk or capital preservation.  BDCs that continue to trade at lower NAV per share multiples will be capital constrained and could risk losing various credit ratings that could contribute to a higher cost of capital.

There will likely be continued basket and tax-loss selling but at some point I believe BDCs will rebound sharply as they did after the October 15th lows. Also I believe investors will continue to pay higher multiples for higher quality BDCs giving them a clear advantage going into 2015.

Premium Reports:

There are currently over 35 reports available as discussed in “Premium Reports”.
  •  $60 for all reports through 3/31/15.
  •  $95 for all reports through 6/30/15.
  •  $165 for all reports through 12/31/15.